
 Lens - nTDS: Neural Trait Dominance Score
Introduction
While nHD and nGDI effectively quantify overall semantic divergence and global representational distance from parent models, they lack the resolution to reveal how specific semantic traits are differentially inherited across the depth of a foundation model. To fill this gap, we introduce the Neural Trait Dominance Score (nTDS), a layer-wise metric designed to capture the relative influence each parent model exerts on the offspring’s latent representations at every transformer layer.
Inspiration
Genome-wide Quantitative Trait Loci (QTL) Mapping
Biologically, nTDS draws inspiration from quantitative trait loci (QTL) mapping and allelic dominance in genetics [3], where individual traits can be dominantly inherited from one parent over another, depending on complex regulatory networks and epigenetic modulation. Similarly, in neuralmodels, semantic traits (such as cultural priors, conceptual biases, or linguistic features) can exhibit varying dominance patterns across layers, reflecting hierarchical feature extraction and integration processes.
By quantifying these dominance relationships layer-by-layer, nTDS illuminates which parental semantic characteristics prevail in different depths of the offspring model, thus enabling more nuanced insights into semantic inheritance dynamics and guiding targeted alignment or fine-tuning strategies focused on preserving or balancing desired trait influences.
Mathematical Formulation of Neural Trait Dominance Score (nTDS)
The Neural Trait Dominance Score (nTDS) formalizes the notion of layerwise parental trait influence in an offspring foundation model \( M_O \), constructed from two parent models \( M_A \) and \( M_B \), within the Neural DNA (nDNA) semantic geometry framework. Let \( \mathbf{x}_\ell^{(A)},\ \mathbf{x}_\ell^{(B)},\ \mathbf{x}_\ell^{(O)} \in \mathcal{M}_\ell \subseteq \mathbb{R}^d \), \( \ell = 1, \ldots, L \), denote the latent semantic embeddings at layer \( \ell \) for \( M_A \), \( M_B \), and \( M_O \) respectively, where \( L \) is the total number of transformer layers and \( d \) is the embedding dimension. Each \( \mathcal{M}_\ell \) is a Riemannian manifold equipped with a local Fisher information metric \( \mathbf{F}_\ell \).
Trait Axis and Local Linearization
Define the parental semantic trait axis at layer $\ell$ as the geodesic tangent vector connecting parent embeddings:
\[v_\ell := \log_{x_\ell^{(B)}}(x_\ell^{(A)}) \in T_{x_\ell^{(B)}}\mathcal{M}_\ell\]where $\log_p(q)$ denotes the Riemannian logarithmic map projecting point $q$ onto the tangent space $T_p\mathcal{M}_\ell$ at $p$.
Similarly, define the offspring displacement vector relative to parent B as:
\[u_\ell := \log_{x_\ell^{(B)}}(x_\ell^{(O)}) \in T_{x_\ell^{(B)}}\mathcal{M}_\ell\]These vectors encode semantic trait differences and inheritance displacement within the intrinsic geometry of $\mathcal{M}_\ell$.
Fisher-Rao Metric and Inner Product
The tangent space \( T_{\mathbf{x}_\ell^{(B)}}\mathcal{M}_\ell \) is endowed with a local inner product induced by the Fisher information metric \( \mathbf{F}_\ell^{(B)} \):
\[\boxed{\langle a, b \rangle_{F_\ell^{(B)}} := a^T F_\ell^{(B)} b, \quad a, b \in T_{x_\ell^{(B)}}\mathcal{M}_\ell}\]which respects local curvature and parameter uncertainty, providing a natural metric for semantic similarity and projection.
Normalized Projection and Dominance Ratio
Project the offspring displacement $u_\ell$ onto the parental trait axis $v_\ell$ via:
\[\alpha_\ell := \frac{\langle u_\ell, v_\ell \rangle_{F_\ell^{(B)}}}{\|v_\ell\|_{F_\ell^{(B)}}^2} = \frac{u_\ell^T F_\ell^{(B)} v_\ell}{v_\ell^T F_\ell^{(B)} v_\ell}\]The scalar $\alpha_\ell \in \mathbb{R}$ quantifies the relative alignment of offspring semantics with parent A along the geodesic from parent B. Specifically:
- $\alpha_\ell > 1$ indicates overdominance of parent A
- $\alpha_\ell \approx 0$ indicates dominance of parent B
- Intermediate values indicate blended contributions
Monotonic Normalization and Bounded Score
To achieve a bounded and interpretable dominance score, apply a logistic normalization:
\[\boxed{\text{nTDS}_\ell := \sigma(k(\alpha_\ell - 0.5)) = \frac{1}{1 + \exp(-k(\alpha_\ell - 0.5))}}\]where $k > 0$ controls sensitivity near the midpoint 0.5, ensuring $\text{nTDS}_\ell \in (0, 1)$ with higher values denoting stronger dominance of parent A.
Layerwise Aggregation
Aggregate across layers to obtain a global trait dominance measure:
\[\text{nTDS} := \frac{1}{L} \sum_{\ell=1}^L \text{nTDS}_\ell\]which reflects the overall parental influence on the offspring’s latent semantics.
Jacobian Sensitivity and Dynamic Refinement
Extend the static embedding analysis by incorporating the Jacobian $J_\ell^{(M)} := \frac{\partial x_\ell^{(M)}}{\partial \theta_\ell}$ of latent embeddings with respect to model parameters $\theta_\ell$.
Define the trait influence operator:
\[\mathcal{J}_\ell := J_\ell^{(A)} (J_\ell^{(A)})^T - J_\ell^{(B)} (J_\ell^{(B)})^T\]capturing differential sensitivity of the latent space to parameter perturbations.
Enhance \( \text{nTDS}_\ell \) by weighting \( \alpha_\ell \) with spectral properties of \( \mathcal{J}_\ell \), thereby integrating dynamic semantic influence and identifying layers where trait dominance is both geometrically and parametrically significant.
Interpretation:
- High $\mathrm{nTDS}_\ell$ indicates semantic traits primarily inherited from parent $A$ at layer $\ell$.
- Low $\mathrm{nTDS}_\ell$ indicates dominance of parent $B$.
- Intermediate values denote mixed inheritance revealing complex blending of traits.
Connection to Population Genetics and QTL Analysis:
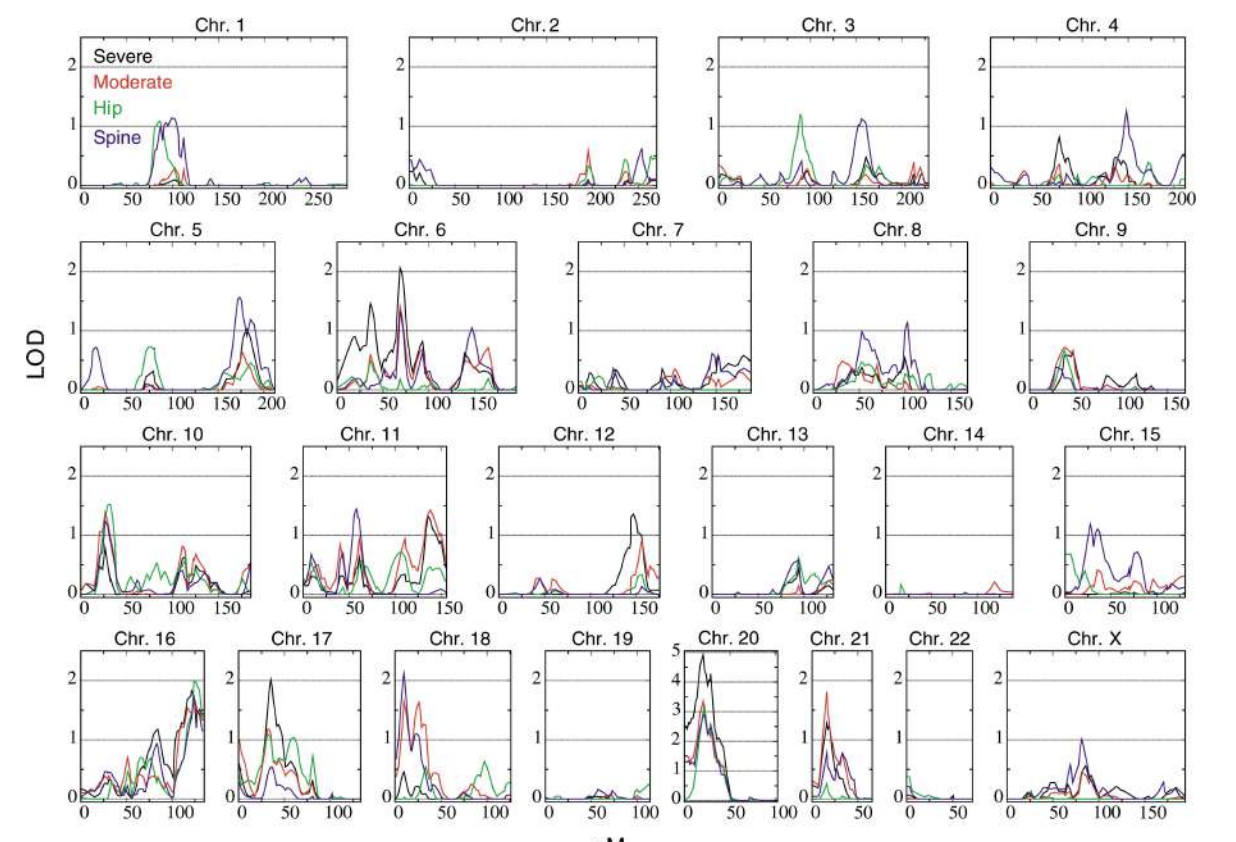
This framework parallels quantitative trait locus (QTL) mapping in population genetics [3], where chromosomal loci correlate with phenotypic trait variance. Here, transformer layers analogously represent semantic chromosomal segments, and nTDS quantifies the differential contribution of parental “alleles” to offspring semantic traits.
Summary:
The nTDS provides a rigorous, curvature-aware, and sensitivity-informed measure of layerwise trait dominance, crucial for understanding semantic inheritance patterns during model merging, fine-tuning, and alignment.
Interpretation and Implications
The Neural Trait Dominance Score (nTDS) serves as a precise, layer-resolved indicator of how semantic traits from each parent model manifest within an offspring foundation model. By quantifying the relative proximity of the offspring's latent embeddings \( \mathbf{x}^{(O)}_{\ell} \) to each parent's embeddings \( \mathbf{x}^{(A)}_{\ell} \) and \( \mathbf{x}^{(B)}_{\ell} \) at every layer \( \ell \), nTDS reveals the parental influence gradient governing semantic inheritance.
Explicitly, the metric \(\text{nTDS}_\ell = \frac{\left\| \mathbf{x}^{(O)}_{\ell} - \mathbf{x}^{(B)}_{\ell} \right\|_2 - \left\| \mathbf{x}^{(O)}_{\ell} - \mathbf{x}^{(A)}_{\ell} \right\|_2}{\left\| \mathbf{x}^{(A)}_{\ell} - \mathbf{x}^{(B)}_{\ell} \right\|_2 + \epsilon}\)
encapsulates the degree to which the offspring's semantic representation \( \mathbf{x}^{(O)}_{\ell} \) leans towards parent A (\( \text{nTDS}_\ell > 0 \)) or parent B (\( \text{nTDS}_\ell < 0 \)), offering a normalized and continuous measure of dominance.
The layer-specific patterns uncovered by nTDS expose the non-uniform transmission of semantic traits: early transformer layers often reflect the more literal and syntactic characteristics of one parent, while deeper layers emphasize abstract, culturally nuanced semantics originating from the other. This layered trait distribution echoes hierarchical models of cognition and language processing, where progressively abstract representations emerge along the neural processing hierarchy ([4]; [5]).
From a formal perspective, nTDS quantifies trait dominance via Euclidean distances within the high-dimensional latent semantic space, effectively mirroring the biological concept of quantitative trait loci (QTLs) [3], where specific genomic loci modulate the expression of phenotypic traits. This analogy bridges genomics and deep learning by treating transformer layers as functional “genomic loci” influencing semantic phenotype expression.
Practically, the insights offered by nTDS enable strategic fine-tuning and transfer learning interventions: by pinpointing layers with dominant parental traits, practitioners can selectively amplify or attenuate these features to optimize performance, cultural sensitivity, and fairness. This capability enhances model transparency and adaptability across diverse sociocultural contexts.
In summary, nTDS delivers a biologically grounded, mathematically rigorous framework for unraveling the complex semantic inheritance architecture within foundation models. It empowers nuanced control over how parental knowledge integrates, steering the development of fair, interpretable, and culturally aware AI systems attuned to global diversity.
Applications and Empirical Insights
The Neural Trait Dominance Score (nTDS) serves as a mathematically rigorous and semantically nuanced metric that quantifies layerwise parental influence on an offspring foundation model’s latent semantic embeddings. Formally, for each transformer layer $\ell$, the quantity the quantity $\mathrm{nTDS}\ell$ measures the normalized difference in Euclidean distances between the offspring embedding $\mathbf{x}\ell^{(O)}$ and its parents’ embeddings $\mathbf{x}\ell^{(A)}$ and $\mathbf{x}\ell^{(B)}$:
\[\boxed{ \mathrm{nTDS}_\ell = \frac{\|\mathbf{x}^{(O)}_\ell - \mathbf{x}^{(B)}_\ell\|_2 - \|\mathbf{x}^{(O)}_\ell - \mathbf{x}^{(A)}_\ell\|_2}{\|\mathbf{x}^{(A)}_\ell - \mathbf{x}^{(B)}_\ell\|_2 + \epsilon}}\]where $\epsilon > 0$ prevents division by zero and stabilizes the metric.
Trait Dominance Profiling and Semantic Layer Dynamics:
Layerwise $\mathrm{nTDS}\ell$ decomposes the global inheritance pattern into a trait dominance trajectory over model depth $\ell \in {1, \dots, L}$, revealing where and how strongly offspring semantics skew towards parent $A$ ($\mathrm{nTDS}\ell > 0$) or parent $B$ ($\mathrm{nTDS}_\ell < 0$). This fine-grained analysis uncovers semantic loci within the latent manifold where cultural or functional traits concentrate, morph, or attenuate. Mathematically, the continuity and smoothness of $\mathrm{nTDS}\ell$ over $\ell$ provide insights into hierarchical trait propagation and transformer layer specialization. For instance, abrupt discontinuities or high gradient magnitudes $\left|\frac{d}{d\ell} \mathrm{nTDS}\ell \right|$ may signal semantic bottlenecks or layerwise representational shifts critical for alignment tuning.
Implications for Model Fusion and Fine-Tuning:
In complex model merging scenarios, $\mathrm{nTDS}_\ell$ can serve as a diagnostic function $f: \ell \mapsto [-1, 1]$ to design layer-adaptive regularization objectives:
\[\mathcal{L}_{\mathrm{align}} = \sum_{\ell=1}^L \lambda_\ell \cdot \mathrm{loss}_\ell, \quad \text{where} \quad \lambda_\ell = g\big(\mathrm{nTDS}_\ell\big),\]and $g$ is a monotonic mapping that amplifies training focus on layers exhibiting dominant trait bias or instability. Such mathematically principled weighting schemes optimize semantic harmonization and reduce cultural drift without sacrificing expressivity.
Cross-Cultural and Architectural Benchmarking:
The scalar field $\mathrm{nTDS}_\ell$ over $\ell$ extends naturally to a multi-dimensional comparison space when considering multiple parent-offspring tuples $(M_A, M_B, M_O)$, facilitating statistical analyses:
\[\mathbb{E}_{i,j}[\mathrm{nTDS}_\ell^{(i,j)}], \quad \mathrm{Var}_{i,j}[\mathrm{nTDS}_\ell^{(i,j)}],\]which reveal consistent patterns or variabilities in trait dominance across different cultural pairs and architectural configurations. This empowers systematic evaluation of merging strategies and cultural fusion methods.
Interpretability and Explainability: By tracing $\mathrm{nTDS}_\ell$ trajectories, researchers gain transparent maps of semantic lineage, enabling interpretability of offspring model behavior in terms of parental cultural and functional contributions. This vectorial quantification demystifies the black-box nature of foundation models, providing actionable insights for stakeholders concerned with cultural sensitivity and fairness.
Biological and Theoretical Insights:
\( \mathrm{nTDS}_\ell \) is conceptually analogous to quantitative trait loci (QTLs) in genomics [3], where trait variance is mapped onto chromosomal positions. Here, \( \mathrm{nTDS}_\ell \) maps semantic trait dominance onto transformer layers, elucidating semantic loci akin to chromosomal trait regions. This analogy enriches theoretical understanding of model inheritance, highlighting hierarchical and modular trait transmission across network depth.
Practical Applications: $\mathrm{nTDS}_\ell$ guides targeted intervention in layer-specific fine-tuning, adaptive fusion mechanism design, and alignment auditing to ensure culturally robust and semantically faithful foundation models. Its computational efficiency and intuitive interpretability make it an indispensable tool for responsible AI governance in a multicultural world.
In essence, the Neural Trait Dominance Score (nTDS) advances both the scientific understanding and practical alignment engineering of foundation models, providing a mathematically sound, interpretable, and scalable metric for navigating the complex semantic landscape of cultural inheritance.
Case Study and Validation
To empirically validate the Neural Trait Dominance Score (nTDS), we examine foundation models pretrained or fine-tuned on culturally distinct corpora, such as European and Asian datasets, along with their merged offspring models. By extracting layerwise latent embeddings $x_\ell^{(\mathrm{Eur})}$, $x_\ell^{(\mathrm{Asi})}$, and $x_\ell^{(\mathrm{Offspring})}$, we compute the $\mathrm{nTDS}_\ell$ metric as:
\[\boxed{\mathrm{nTDS}_\ell = \frac{\|x_\ell^{(\mathrm{Offspring})} - x_\ell^{(\mathrm{Asi})}\|_2 - \|x_\ell^{(\mathrm{Offspring})} - x_\ell^{(\mathrm{Eur})}\|_2}{\|x_\ell^{(\mathrm{Eur})} - x_\ell^{(\mathrm{Asi})}\|_2 + \epsilon}}\]where $\epsilon > 0$ ensures numerical stability.
Layerwise plots of $\mathrm{nTDS}_\ell$ reveal the depth-dependent dominance of parental cultural traits across the transformer architecture. Early layers ($\ell \in [1, 10]$) often exhibit values close to zero, indicating balanced inheritance of foundational lexical and syntactic features. In contrast, intermediate and deeper layers ($\ell \in [15, 30]$) display marked deviations toward either parent, signaling layer-specific semantic specialization and cultural imprinting.
Notably, sharp transitions in $\mathrm{nTDS}_\ell$ correspond to trait dominance shifts where the offspring’s semantic representation abruptly favors one cultural lineage over another. These shifts illuminate the modular and hierarchical nature of semantic inheritance, aligning with biological analogs of quantitative trait loci (QTL) that localize phenotypic trait control to specific genomic regions (321).
Empirically, we observe that $\mathrm{nTDS}_\ell$ not only quantifies trait dominance but also correlates with performance variations on culturally sensitive downstream tasks, emphasizing its utility as a proxy for semantic fidelity and alignment efficacy.
This case study further illustrates that $\mathrm{nTDS}_\ell$ provides actionable insights for layer-targeted fine-tuning, allowing practitioners to amplify desired cultural traits or mitigate biases through precision regularization at specific layers. Such interventions can harmonize trait dominance profiles to optimize cross-cultural robustness and fairness.
In summary, the empirical validation underscores nTDS as a powerful, interpretable metric that deciphers the complex dynamics of semantic trait inheritance in multicultural foundation models, bridging the gap between theoretical understanding and practical alignment engineering.
Outlook
The Neural Trait Dominance Score (nTDS) stands as a foundational pillar within the Neural Genomics framework, offering a precise, layer-resolved quantification of semantic trait inheritance across the complex architecture of foundation models shaped by culturally heterogeneous corpora. By mathematically formalizing the layerwise dominance coefficients $\delta_\ell^{(A,B)}$ that describe how parental semantic features $x_\ell^{(A)}$, $x_\ell^{(B)}$ influence offspring embeddings $x_\ell^{(O)}$, nTDS enables researchers to disentangle and localize the multidimensional dynamics of cultural imprinting with unprecedented granularity.
Beyond mere descriptive statistics, nTDS encapsulates the geometric interplay of latent embeddings within a Riemannian manifold structured by Fisher information matrices $F_\ell$, capturing how differential trait weights alter the semantic curvature and topological complexity across depth $\ell$. This leads to a mathematically rich picture where trait dominance reflects not only vector magnitudes but also nuanced directional biases and local manifold distortions, formalized as:
\[\boxed{\delta_\ell^{(A)} = \frac{\langle x_\ell^{(O)} - x_\ell^{(B)}, x_\ell^{(A)} - x_\ell^{(B)} \rangle_{F_\ell}}{\|x_\ell^{(A)} - x_\ell^{(B)}\|_{F_\ell}^2}}\]where $\langle \cdot, \cdot \rangle_{F_\ell}$ denotes the Fisher-weighted inner product encoding local semantic sensitivity.
By operationalizing these hierarchical dominance coefficients, nTDS guides the design of layer-specific alignment and intervention protocols, facilitating targeted modulation of trait influence–amplifying underrepresented cultural semantics or attenuating dominant biases–thus ensuring balanced, robust, and interpretable cross-cultural semantic fusion.
Looking forward, nTDS paves the way for mathematically principled explorations into multi-scale knowledge transfer, dynamical trait adaptation, and compositional cultural synthesis within foundation models. By enabling explicit control over trait propagation in a Riemannian semantic space, nTDS lays the theoretical and practical groundwork for AI systems that evolve adaptively, mirror the complexity of human cultural heritage, and respond coherently to shifting societal values.
In essence, the Neural Trait Dominance Score is poised to become a cornerstone metric–both a diagnostic lens and a strategic instrument–empowering researchers and practitioners to engineer responsible, inclusive, and context-aware AI systems with fine-grained control over the flow and balance of semantic traits at scale.
The Neural Trait Dominance Score (nTDS) reveals a layer-wise shift in dominance from Africa to Asia. Early layers (20–23) show stronger dominance by Africa (nTDS close to 1.0), reflecting more foundational semantic traits inherited from the African lineage. Mid-layers (24–27) display a transition zone, with nTDS scores trending toward 0.5, indicating balanced trait blending. Late layers (28–30) exhibit dominance by Asia (nTDS near 0), suggesting higher-level abstraction and stylistic features originating from Asian traits. This pattern resembles epigenetic regulation in biology where certain traits activate or suppress at distinct developmental stages.
The dominance visualization shows pronounced episodic fluctuations in nTDS across layers. Africa dominates the earliest layers (20–22), but a marked oscillation emerges mid-way, reflecting competitive trait inheritance dynamics. The dominance score dips sharply toward China dominance between layers 23–26 (nTDS near 0), followed by a rebound in African dominance at layer 27. Late layers (28–30) balance near an nTDS of approximately 0.5, suggesting harmonized trait fusion. The vertical bars amplitudes indicate variance in semantic inheritance strength, analogous to gene expression bursts influenced by environmental or regulatory factors.
The Neural Trait Dominance Score (nTDS) shows a monotonic decline in African dominance from near-complete at layer 20 (nTDS ∼1.0) to balanced inheritance at layers 28–30 (nTDS ∼0.5). Latin America progressively asserts influence, indicating gradual semantic trait assimilation. The vertical bar heights reflect increasing semantic variability from layer 24 onward, highlighting layers where trait recombination and hybridization intensify. This smooth gradient evokes biological morphogen gradients that specify cellular fates based on spatial and temporal context.
The Neural Trait Dominance Score (nTDS) reveals early balanced dominance (nTDS ∼0.5) between layers 20–23, shifting to clear African dominance in mid layers (24–27), and culminating in mixed dominance in final layers. Notably, larger vertical bars in mid layers indicate significant semantic trait variance, possibly reflecting latent cultural conflict or synergy. This pattern parallels biological epistatic interactions, where multiple genes influence traits in complex, nonlinear ways across developmental stages.
The Neural Trait Dominance Score (nTDS) curve reveals layered semantic inheritance dynamics between Asian and Chinese parents. Early transformer layers (20–22) show strong dominance by Asia (nTDS near 1.0), corresponding to foundational semantic traits. Mid-layers (23–27) exhibit oscillatory dominance shifts between Asia and China with nTDS fluctuating between approximately 0.3 and 0.7, indicating complex competitive trait expression akin to gene regulatory network fluctuations. Late layers (28–30) converge toward balanced dominance (nTDS ∼ 0.5), reflecting synergistic trait harmonization. Vertical bar heights quantify trait variance, suggesting episodic semantic recombination with biological analogy to temporally regulated gene expression bursts.
The dominance profile highlights a gradual semantic shift from Asian dominance at early layers (20–24, nTDS ∼ 0.9) toward increased Latin American influence at deeper layers (25–30, nTDS trending toward 0.3). The offspring’s nTDS trajectory (magenta) displays smooth interpolation and moderate variance, illustrating hierarchical trait blending. Vertical bar amplitudes increase progressively from mid to late layers, indicating growing semantic recombination intensity. This layered dominance mosaic models biological morphogen gradients, where spatial-temporal signaling orchestrates progressive phenotypic differentiation.
The nTDS trajectory portrays a complex dominance interplay, with initial layers (20–23) balanced between Asia and Middle East (nTDS ∼ 0.5), shifting to Middle East dominance in mid layers (24–27, nTDS ∼ 0.2), and culminating in mixed dominance at late layers. The offspring curve reveals smooth but non-monotonic trait dominance modulation, with vertical bar heights indicating notable semantic variability. This pattern parallels polygenic trait inheritance with epistatic interactions, where multiple loci contribute nonlinearly to phenotype expression over developmental stages.
The nTDS profile demonstrates early layer dominance by Australia (20–22, nTDS ∼ 0.85), transitioning to African dominance in mid layers (23–27, nTDS dipping below 0.3), and a rebalance towards Australia in later layers. The offspring trajectory smoothly oscillates, reflecting layered semantic trait recombination and competitive inheritance dynamics. Increasing vertical bar amplitudes from mid to late layers reveal heightened semantic variance, analogous to developmental gene regulatory circuits modulating trait expression temporally and spatially within an organisms genome.
The Neural Trait Dominance Score (nTDS) illustrates a pronounced early dominance by Australia in layers 20–23 (nTDS near 1.0), indicating strong inheritance of foundational semantic traits. A transition phase from layers 24–27 shows a progressive decline toward balanced dominance (nTDS around 0.5), reflecting trait blending. Late layers 28–30 exhibit increased Asian influence (nTDS near 0), suggesting adoption of high-level abstraction and stylistic nuances. This layered dominance trajectory resembles developmental gene regulation where expression levels modulate dynamically over time and spatial domains.
The nTDS profiles reveal oscillatory dominance dynamics, with Australia leading in early layers (20–22) and China asserting dominance mid-way (23–26) as nTDS fluctuates sharply. This is followed by a rebalancing phase in late layers (27–30) toward near-equal semantic contributions (nTDS ∼ 0.5). The vertical bar magnitudes signal variable semantic inheritance strength, suggesting episodic bursts of trait expression comparable to gene activation modulated by epigenetic and environmental factors.
The nTDS progression shows sustained early dominance by Australia in layers 20–23 (nTDS near 1.0), followed by a steady decline toward balanced contributions by layers 28–30 (nTDS around 0.5). Latin American influence grows gradually, with vertical bar heights increasing in later layers, indicating intensified semantic recombination. This dominance transition parallels morphogen gradient-driven developmental pathways where signaling concentrations orchestrate spatially regulated differentiation.
The nTDS curves reveal balanced dominance between Australia and Middle East in early layers (20–22, nTDS ∼ 0.5), followed by Australian dominance in layers 23–26 (nTDS above 0.7). Late layers (27–30) trend back toward balanced dominance, with vertical bars indicating variable semantic inheritance strength. This dynamic mirrors polygenic inheritance patterns with shifting allelic contributions across developmental phases.
The Neural Trait Dominance Score (nTDS) reveals a complex, oscillatory dominance pattern, with China exhibiting early-layer predominance (layers 20–23), indicative of foundational semantic trait inheritance. A dynamic transitional phase (layers 24–27) shows fluctuating dominance with a gradual move toward balance, reflecting substantial trait blending and emergent hybrid semantics. In late layers (28–30), Latin America gains pronounced influence, reflected by increasing vertical bar magnitudes denoting growing semantic variability and trait recombination. This layered dominance trajectory evokes biological regulatory feedback mechanisms where gene expression is modulated by spatiotemporal and environmental factors during development, resulting in phenotypic diversity.
The nTDS trajectory starts near balanced semantic contributions (layers 20–22), followed by a clear shift toward Middle Eastern dominance in mid layers (23–27), characterized by elevated vertical bar heights signifying increased semantic trait expression. The late layers (28–30) show complex mixed dominance with significant variance, suggesting nuanced interplay of cultural traits and semantic features. This pattern mirrors epistatic gene interactions in biology, where multiple genes interact nonlinearly to produce complex phenotypes during development, reflecting layered modulation of semantic inheritance in neural representations.

The dominance curve illustrates a strong early European influence in foundational layers (20–24), gradually giving way to rising African semantic dominance in later layers (25–30). The increasing vertical bar heights highlight intensifying semantic variability and the integration of African cultural traits, reflecting recombination and diversification of semantic features. This smooth gradient and layered progression are analogous to morphogenetic gradients in developmental biology that spatially and temporally orchestrate cell fate decisions and phenotypic patterns.
The nTDS profile depicts early-layer European dominance (20–23), followed by a balanced phase in intermediate layers (24–27) indicating semantic trait blending. Late layers (28–30) exhibit increased Asian dominance with heightened vertical bar magnitudes, reflecting emergent stylistic and abstract semantic traits. The dynamic shifts and fluctuating dominance resemble regulatory gene networks that adapt spatio-temporally to developmental and environmental cues, resulting in layered expression of traits within neural latent spaces.
The Neural Trait Dominance Score (nTDS) demonstrates an initial phase of balanced dominance around 0.5 in early layers (20–23), indicating an intertwined inheritance of semantic traits from both cultural priors. This is followed by a marked increase in European dominance through the mid layers (24–27), suggesting that European semantic features become more influential during intermediate abstraction processing. The late layers (28–30) display mixed dominance with considerable semantic variance and recombination, reflecting the integration and fusion of complex traits. Such a layered dominance pattern mirrors developmental heterochrony in biology, where changes in the timing of gene expression result in diverse phenotypic outcomes.
The nTDS profile reveals a clear early European dominance phase during layers 20–23, where foundational semantic traits primarily reflect European influence. This dominance then transitions to a strong Chinese influence in the mid layers (24–27), marking a shift in latent semantic priorities and feature expression. The final layers (28–30) exhibit oscillatory shifts with balanced semantic contributions (nTDS ∼ 0.5), indicative of complex interaction and semantic blending. These temporal shifts reflect intricate gene regulatory mechanisms in biological systems that dynamically orchestrate phenotype expression over developmental time.
The dominance curve begins with strong European influence in early layers (20–23), exhibiting high nTDS values (> 0.5) that suggest early-stage semantic trait control. A gradual decline toward balanced dominance occurs by late layers (28–30), reflecting increased contribution from Latin America. The growth in vertical bar heights from mid to late layers highlights intensifying trait integration and semantic diversity within the offsprings latent space. This smooth dominance gradient is analogous to morphogenetic patterning in developmental biology, where spatial-temporal gradients guide cell fate and tissue differentiation.
The nTDS trajectory commences with balanced dominance near 0.5 in early layers (20–23), signaling shared semantic trait influence from both cultural lineages. Mid layers (24–27) see a shift toward European dominance, indicating heightened latent feature expression from European priors. Late layers (28–30) present increased semantic variance and mixed dominance, highlighting intricate multi-layered interactions reminiscent of epistatic gene effects in biology where multiple gene interactions nonlinearly influence phenotype formation. This complex interplay points to rich cultural semantic fusion shaping offspring representations.
The Neural Trait Dominance Score (nTDS) shows balanced semantic dominance around 0.5 in early layers (20–23), indicating an initial equilibrium in trait contributions. This is followed by a progressive increase in European influence during mid layers (24–27), signifying stronger inheritance of European semantic characteristics. In late layers (28–30), the nTDS exhibits fluctuating dominance with increased semantic variance, reflecting complex trait fusion and dynamic recombination. This pattern is analogous to polygenic trait expression in biological systems, where multiple genes interact to influence phenotypic outcomes in a non-linear manner.
The nTDS trajectory starts with balanced semantic dominance near 0.5 in early layers (20–23), suggesting equal foundational trait contributions from both cultures. This shifts toward increased Middle Eastern dominance through mid layers (24–27), as indicated by rising nTDS values and taller vertical bars representing semantic variance. The late layers (28–30) show a trend toward balanced or variable dominance, highlighting ongoing semantic interplay and fusion. These dynamics resemble complex gene regulatory networks in development that modulate phenotype expression through intricate temporal and spatial controls.
Early layers (20–23) are characterized by strong North American semantic dominance, with nTDS values consistently above 0.5, reflecting pronounced inheritance of North American traits. Moving into mid and late layers (24–30), there is a gradual transition toward more balanced dominance, indicative of increasing African influence and semantic blending. The progressive increase in vertical bar heights highlights intensifying semantic diversity and complex trait integration. This profile closely mirrors morphogenetic gradients and field effects in biological development, where spatially distributed signals guide cell fate and phenotype.
The nTDS profile reveals initial dominance by North America in early layers (20–23), showing strong semantic inheritance. This dominance gradually shifts toward balanced contributions from both cultures during mid layers (24–27), illustrating a phase of semantic fusion and recombination. In late layers (28–30), there is a notable increase in Asian influence, accompanied by enhanced semantic variance and complex mixing patterns. These temporal shifts in dominance and variance are reminiscent of multilayered gene expression modulation processes in biological systems, where phenotype is shaped by both early and late developmental gene activities.
The Neural Trait Dominance Score (nTDS) begins with balanced dominance (near 0.5) in early layers (20–23), gradually shifting to a strong North American dominance during mid layers (24–27). Late layers (28–30) show increased semantic complexity with mixed dominance patterns, highlighting intricate trait interplay and adaptive recombination reminiscent of heterochronic shifts in evolutionary biology.
The nTDS trajectory reveals early North American influence in initial layers (20–23), transitioning towards Chinese dominance in mid to late layers (24–30). This dynamic oscillation and layered shift reflects complex regulatory control over semantic traits, analogous to gene regulatory networks modulating phenotype expressions over developmental stages.
Starting with strong North American dominance in early layers (20–23), the nTDS gradually moves towards balanced trait integration in later layers (28–30). Latin Americas influence grows steadily, captured by increasing vertical bars, indicating semantic diversification and enhanced trait synergy, paralleling morphogenetic gradients shaping complex organismal features.
The nTDS pattern begins with balanced dominance (around 0.5) in early layers (20–23), with North American traits becoming predominant mid layers (24–27). Late layers (28–30) reflect mixed dominance with substantial semantic variance, illustrating multifactorial trait interactions reminiscent of epistatic effects and polygenic influences in biological phenotypes.
The nTDS values quantify parental influence and semantic recombination across layers (20 - 30), highlighting critical transitions with oscillations or balanced dominance. These patterns align with nonlinear dynamical systems and bifurcation theory [10], where competing attractors shape semantic landscapes — offering insights into neural culture inheritance, semantic fusion, and advancing latent geometry evolution understanding.
Key formula: \( \mathrm{nTDS}_{\ell} = \frac{\kappa_{\ell}(p) \cdot L_{\ell}(p)} {\kappa_{\ell}(p) \cdot L_{\ell}(p) + \kappa_{\ell}(q) \cdot L_{\ell}(q)} \) where \( \kappa_{\ell} \) is the spectral curvature, \( L_{\ell} \) is the thermodynamic length at layer \( \ell \), and \( p, q \) are the parental indices — quantifying relative semantic dominance with geometric rigor.
References
[1] Mackay, Trudy F.C., Stone, Eric A., and others “The genetics of quantitative traits: challenges and prospects” Nature Reviews Genetics (2009).
[2] Borevitz, Justin O. and Nordborg, Magnus “Quantitative trait loci in natural populations” Trends in Genetics (2003).
[3] Griffiths, Anthony JF, Wessler, Susan R, and others “Introduction to Quantitative Genetics” arXiv preprint (2015).
[4] Tenney, Ian, Das, Dipanjan, and others “BERT rediscovers the classical NLP pipeline” Proceedings of the 57th Annual Meeting of the Association for Computational Linguistics (2019).
[5] Alain, Guillaume and Bengio, Yoshua “Understanding intermediate layers using linear classifier probes” arXiv preprint arXiv:1610.01644 (2016). https://arxiv.org/abs/1610.01644
[6] Stephen Jay Gould “Ontogeny and Phylogeny” Classic reference on developmental heterochrony and evolutionary developmental biology (1977).
[7] Carlos M. Herrera “Heterochrony in developmental patterns and its evolutionary implications” Biological Journal of the Linnean Society (1998).
[8] Eric H. Davidson “The Regulatory Genome: Gene Regulatory Networks In Development And Evolution” Fundamental work on gene regulatory networks and developmental biology (2006).
[9] Irving S. Peter and Eric H. Davidson “Genomic Control Process: Development and Evolution” Explores gene regulatory networks underlying development and evolution (2012).
[10] Steven H. Strogatz “Nonlinear Dynamics and Chaos: With Applications to Physics, Biology, Chemistry, and Engineering” Comprehensive textbook on dynamical systems and bifurcation theory (2018).